
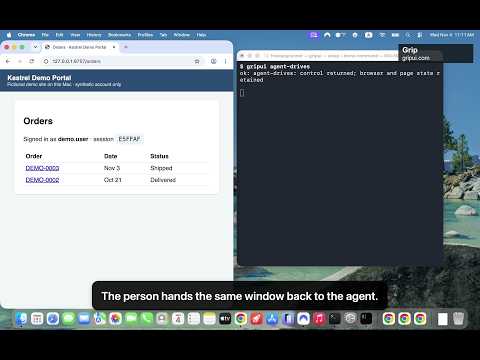
 01 / RECORDED SESSION
The agent hit a sign-in. You take it from there.
The agent is sent to a sign-in. A person takes the browser for the password and the texted code, then hands the same signed-in session back and the agent carries on.
Web workflows / Scripted commands
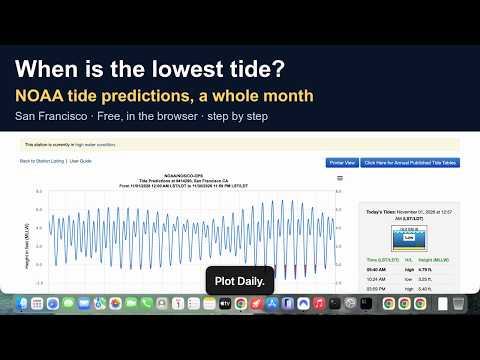
Pick a station, set a date range and a threshold, plot the month and read the data listing. The example is San Francisco in November 2026.
 Watch recording
Loads YouTube when you press play. Open on YouTube ↗
01 / RECORDED SESSION
The agent is sent to a sign-in. A person takes the browser for the password and the texted code, then hands the same signed-in session back and the agent carries on.
 02 / RECORDED SESSION
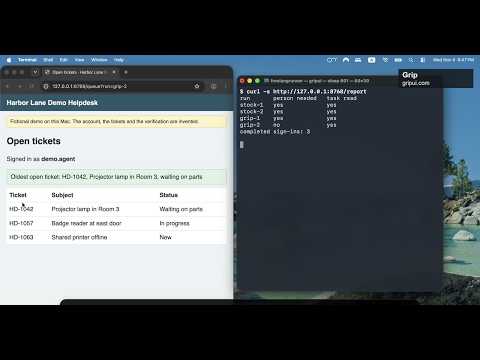
One read-only task behind a sign-in, run twice in a stock Playwright context and twice with gripui on a dedicated profile, to see where each run needed a person.